Business & Finance
Free PNG images in the section “Business & Finance”: 13 files with transparent background, no sign-up.
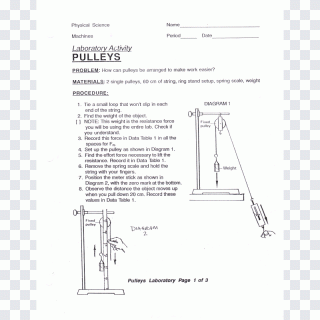
Diagrams more than dollar signs: a network of input nodes feeding one output, a single-line power scheme with a transformer and numbered loads, a wedge splitting a block with force arrows, a hand holding a stopwatch in one line, a looping dashed route — and, carried in by tags, a tiger, a ceiling fan and glazed doors.

 Diagram
36
Diagram
36



 Money
11
Money
11



 Business
6
Business
6



 Presentation
5
Presentation
5

 Chart
4
Chart
4



 Idea
4
Idea
4
 Organization
3
Organization
3

 Credit card
2
Credit card
2
 Target
1
Invoice
1
Graph
1
Target
1
Invoice
1
Graph
1
 Briefcase
1
Briefcase
1
 Office
1
Marketing
1
Office
1
Marketing
1
Popular in this section
 Trousers Jeans, Hand-drawn graphics pant PNG
Tiger, Tigers Tigers, buttoning s, animals PNG
Trousers Jeans, Hand-drawn graphics pant PNG
Tiger, Tigers Tigers, buttoning s, animals PNG
 Stitch line, Google Translate Website PNG
Stopwatch Sketch, stopwatch, white, hand PNG
Ceiling Fans Crompton Greaves Bajaj Auto PNG
Stitch line, Google Translate Website PNG
Stopwatch Sketch, stopwatch, white, hand PNG
Ceiling Fans Crompton Greaves Bajaj Auto PNG
 Personal computer Frames Line art, Room PNG
 Artificial neural network Backpropagation PNG
 Wedge Simple machine Angle Force, text PNG
 Digital camera Drawing Euclidean, hand PNG
 Eye, EYE CARE, white, face PNG
 Aromaticity Simple aromatic ring PNG
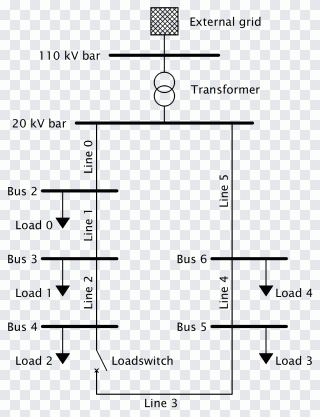 Line Angle White Font, white, text PNG
Door, furniture, simple, rectangle PNG
Line Angle White Font, white, text PNG
Door, furniture, simple, rectangle PNG
Money, office, growth
The section runs from finance — money, coin, bank, credit card, investment, invoice, calculator — through the office — briefcase, contract, presentation, teamwork, handshake — to the language of results: chart, graph, growth, target, sale, discount. Infographic and presentation slide hold ready-made layouts rather than single signs.
Why so many schemes
The source files anything with boxes and arrows under "diagram", and diagram belongs to this section. That is why an engineering drawing or a neural network sketch turns up next to finance. They suit a technical proposal or a training slide well, but a sales deck is better served from chart, growth or presentation.
Charts are illustrations
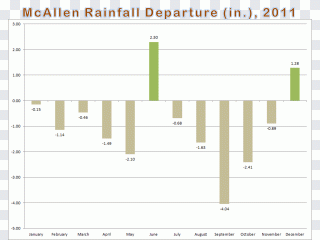
A bar chart or a flow scheme in a picture carries no real data. It signals "numbers" or "process" at a glance and belongs on a cover or a section divider. When a slide is about actual figures, build the chart from your data and keep the picture as an accent — or leave it out, so the two do not contradict each other.